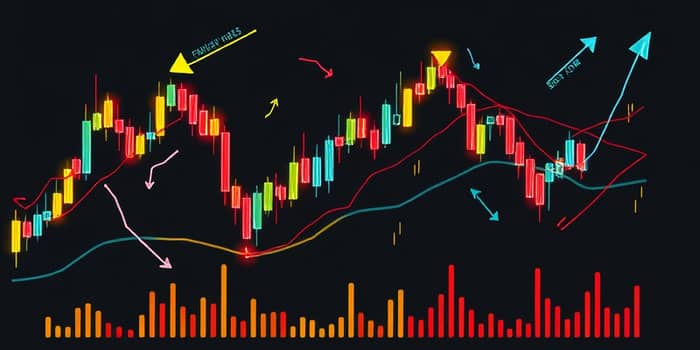
Advanced traders and novices alike rely on visual cues to navigate the complexities of financial markets. Chart patterns offer a structured way to anticipate potential price movements by analyzing graphical formations.
By studying peaks, troughs, and consolidations, traders can gain a strategic advantage. This article delves into the most important formations and shows how to leverage them for consistent success.
Chart patterns are recurring formations on price charts that emerge due to the interplay between supply and demand. They encapsulate collective trader psychology and market sentiment.
Understanding these shapes enables participants to predict future price movements with greater accuracy, identifying moments when markets are likely to pause, reverse, or accelerate.
Reversal formations signal a change in the prevailing trend. Recognizing them early can offer high-probability entries and exits, maximizing potential gains and minimizing losses.
Below are several of the most common reversal chart patterns that every trader should be familiar with:
These formations are powerful but require confirmation through volume or additional indicators to avoid false signals.
Continuation patterns suggest that the current trend will resume after a brief consolidation. They help traders identify pause points before a strong directional move.
When used correctly, these patterns allow for well-timed entries in the direction of the prevailing trend.
These patterns are often key support and resistance levels in disguise, offering clear targets for breakout entries or stop placements.
Integrating chart patterns into a cohesive strategy involves more than pattern recognition. It requires combining patterns with volume analysis and other technical tools for robust decision-making.
Successful traders often follow a multi-step approach:
1. Identify the pattern on the chart, ensuring clear boundaries and consistent price behavior.
2. Wait for a decisive breakout or breakdown, confirmed by a significant increase in trading volume.
3. Enter the trade at the breakout point, placing protective stop-loss orders just beyond the opposite side of the formation.
4. Set profit targets based on the pattern’s measured move, using the pattern’s height projected from the breakout point.
While no pattern guarantees success, historical analysis provides insight into their reliability. Below is a summary of approximate success rates and volume considerations:
To enhance pattern effectiveness, consider the following practical guidelines designed to refine your approach and manage risk efficiently.
Even seasoned traders can misinterpret patterns without proper context. Beware of false breakouts, pattern distortions, and overfitting historical data.
Market environments shift, and what worked in a trending market may fail in a range-bound scenario. Always adapt your strategy to current volatility and liquidity conditions.
For traders seeking deeper refinement, consider these advanced techniques:
• Applying Fibonacci retracement levels to gauge potential reversal zones within patterns.
• Utilizing volume profile analysis to identify hidden support and resistance areas.
• Integrating order flow and market depth data for intraday pattern validation.
These methods complement traditional chart patterns by adding layers of confirmation, helping traders make breakouts or reversals with confidence.
A disciplined trading plan anchors success. Document every trade, noting the pattern, entry and exit points, success or failure, and lessons learned.
Regular review of your trading journal cultivates continuous improvement, ensuring you refine your methods and avoid repeating past mistakes.
Chart patterns serve as the visual language of market psychology, translating complex price action into readable formations that guide trading decisions.
By mastering these patterns and reinforcing them with volume cues, technical indicators, and strict risk controls, traders can unlock setting appropriate stop-loss levels and drive consistent profitability.
Embrace the art and science of pattern analysis, and watch as your trading strategies evolve from reactive guesses to proactive, data-driven insights.
References


